
sleep
Caffeine Curve: See Exactly When Coffee Leaves Your Body
Most people blame stress for bad sleep. Caffeine Curve shows you the real culprit: that 3pm coffee still running at half-strength when you try to wind down.
Artem
Founder
· 5 min read
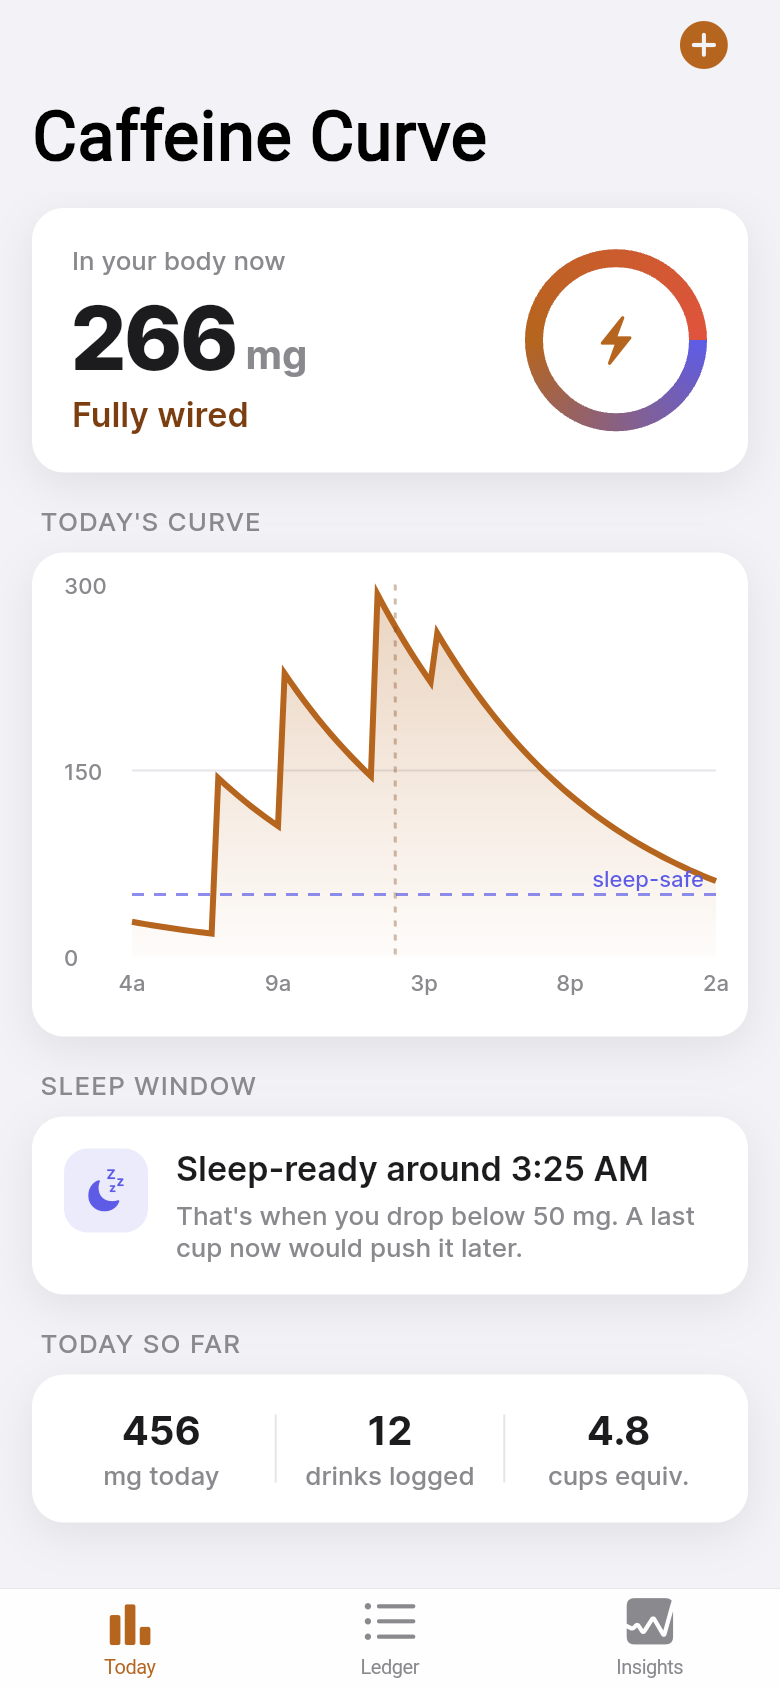
You cut back on screens, you keep a consistent bedtime, you even bought the expensive pillow. But if you had a large coffee or a strong tea at 3pm, roughly half of that caffeine is still circulating in your bloodstream at 8pm. That is not a theory or a rough guess, it is straightforward pharmacokinetics. The trouble is that caffeine is completely invisible, so most people never connect the dots between an afternoon drink and a restless night.
Caffeine Curve makes that connection visible. Log your drinks as you go, and the app draws a live chart of how much caffeine is actually in your body across the full day. It calculates a personalized 'safe to sleep' threshold and tells you plainly when you will drop below it. No medical jargon, no subscription, no account required.
Live demo
The chart that changes how you think about coffee
Open the app and you land on a dashboard that already makes sense. A smooth line rises each time you log a drink, then curves downward as your body clears the caffeine at its natural rate, around a five to six hour half-life. That visual shape is the whole insight. If you had 200mg at 3pm, the line at 10pm still sits around 50mg, which is roughly the caffeine in half a cup of tea.
Most caffeine trackers show you a running total, like a step counter. That number climbs but never falls, so you finish the day knowing you had 400mg without knowing whether any of it still matters. The decay curve is what actually matters, and it is the one thing Caffeine Curve puts front and center.
Try tapping a drink in the embedded demo below. Watch the line reshape in real time. That immediate feedback is what makes the data stick, because you are not reading a number, you are watching your own body's chemistry play out across the day.
Logging a drink takes about three seconds
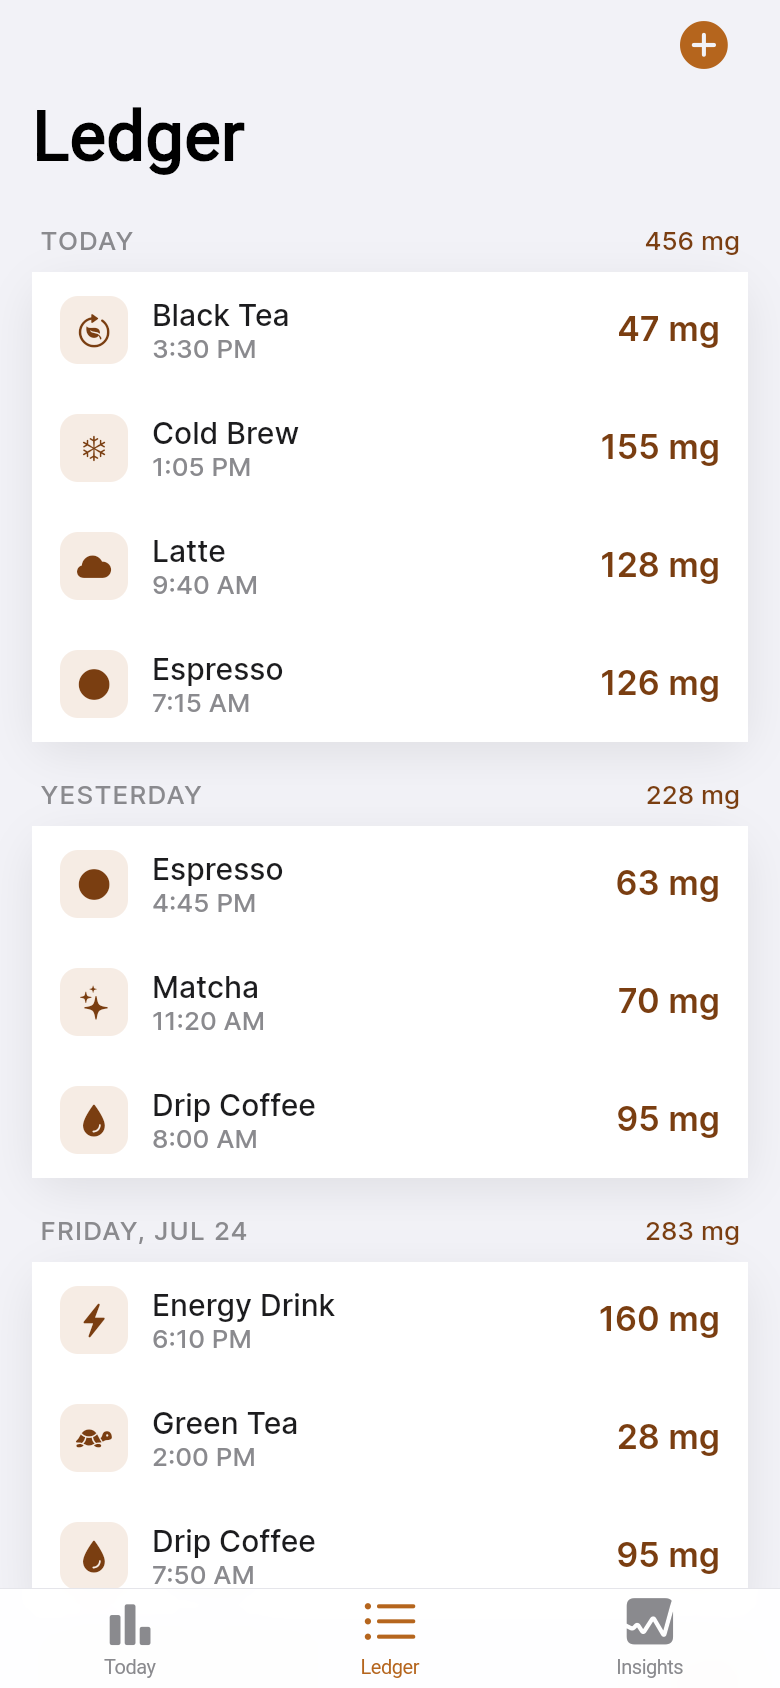
Tracking only works if it costs almost nothing. Caffeine Curve ships with sensible defaults for the drinks most people actually consume: a standard drip coffee, an espresso, a black tea, a green tea, and a few common energy drinks, each with a reasonable caffeine estimate you can adjust if you know your specific brand or brew strength.
Tap the drink, confirm the time (it defaults to right now), and you are done. The chart updates immediately. No account, no syncing spinner, no nudge to upgrade. Everything lives on your device and persists between sessions, so your history is there when you open the app the next morning.
If you brew your own blend or you are particular about grams per litre, you can dial in a custom milligram value. The defaults are accurate enough for most people to get genuinely useful predictions without touching any settings at all.
The 'safe to sleep' prediction is the number that matters
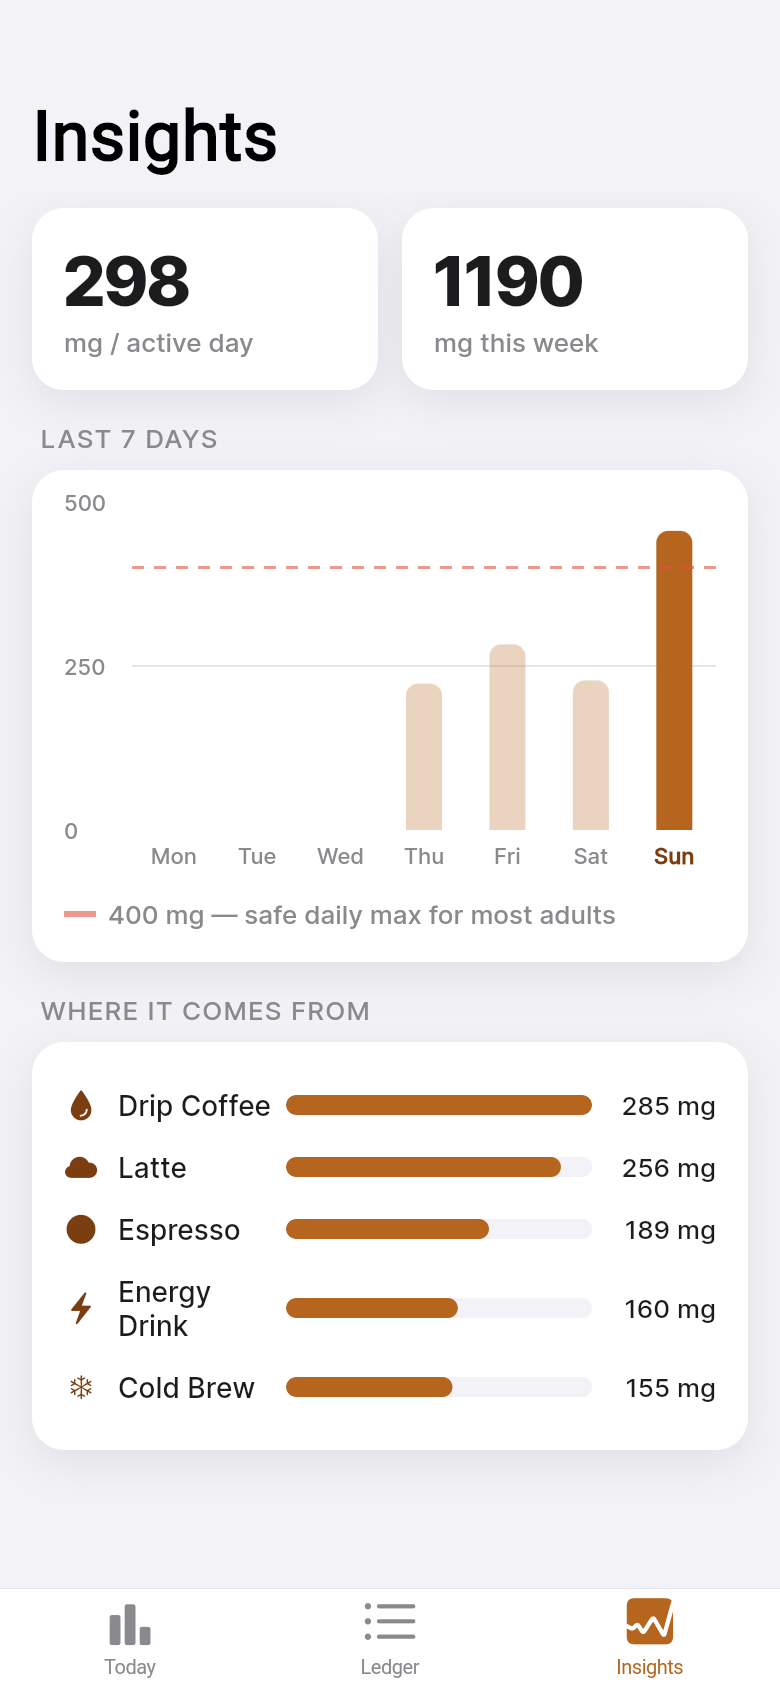
Research on sleep and caffeine generally points to a threshold around 25 to 50mg in the bloodstream as the point where most people can fall asleep without meaningful disruption. Caffeine Curve takes your logged drinks, models the decay from each one, and tells you the specific time when your total will cross below that line.
So instead of a vague 'stop drinking coffee after 2pm', you get something concrete: 'You will be below your sleep threshold at 9:40pm.' If you want to be in bed by 10:30, that is a clear green light. If the prediction says 12:15am, you know why last night felt short even though you were in bed on time.
Shift workers and students with irregular schedules get particular value here, because the cutoff time shifts with your actual drinking pattern. Log a coffee at 11pm before a late shift and the app recalculates everything around that new input, not around an assumed 9-to-5 day.
Who actually finds this useful
Knowledge workers who run on two or three coffees a day and then wonder why they are staring at the ceiling at midnight. Students who drink tea all afternoon during exam season and blame anxiety for the poor sleep. Biohackers who already track sleep with a ring or a watch but want the input data to match the output data. And anyone who has been told by a doctor or a sleep guide to 'watch your caffeine' but has never had a tool that makes watching it concrete.
The app does not try to be a medical device or a wellness platform. It does one thing: it shows you the invisible curve and gives you one actionable number. That focus is what keeps it useful without becoming something you have to manage.
If you are the kind of person who has ever thought 'I barely had any caffeine today' and then checked your memory more carefully, Caffeine Curve tends to be a small revelation. A mid-morning espresso, an afternoon tea, a diet cola with lunch, those add up to a curve that does not cross the sleep line until well past midnight.
Build something that solves your own problem
Caffeine Curve started as a one-line idea: show people the caffeine decay curve so they can see why they sleep badly. From that sentence, the app was designed and built quickly, without a big team or a long roadmap. The core insight was already well-understood science. The hard part was making it immediate and visual enough to actually change behavior.
If you have a problem like that, something you understand clearly but have never had exactly the right tool for, that is the best kind of app to build. The demo in this article is the real thing. Try logging a few drinks and see what your afternoon looks like.
39
files in the build
40.0 MB
app bundle
Flutter Web
runs in any browser
Have a tool idea that would actually help you?
Describe it in one sentence and Leanfinit will turn it into a working app. No team, no timeline, no technical background needed.