
health fitness
Charge Check: Track Energy and Mood Together
Most mood trackers log how you feel, not how charged you are. Charge Check pairs both in one daily tap and shows you what's actually draining you.
Artem
Founder
· 5 min read
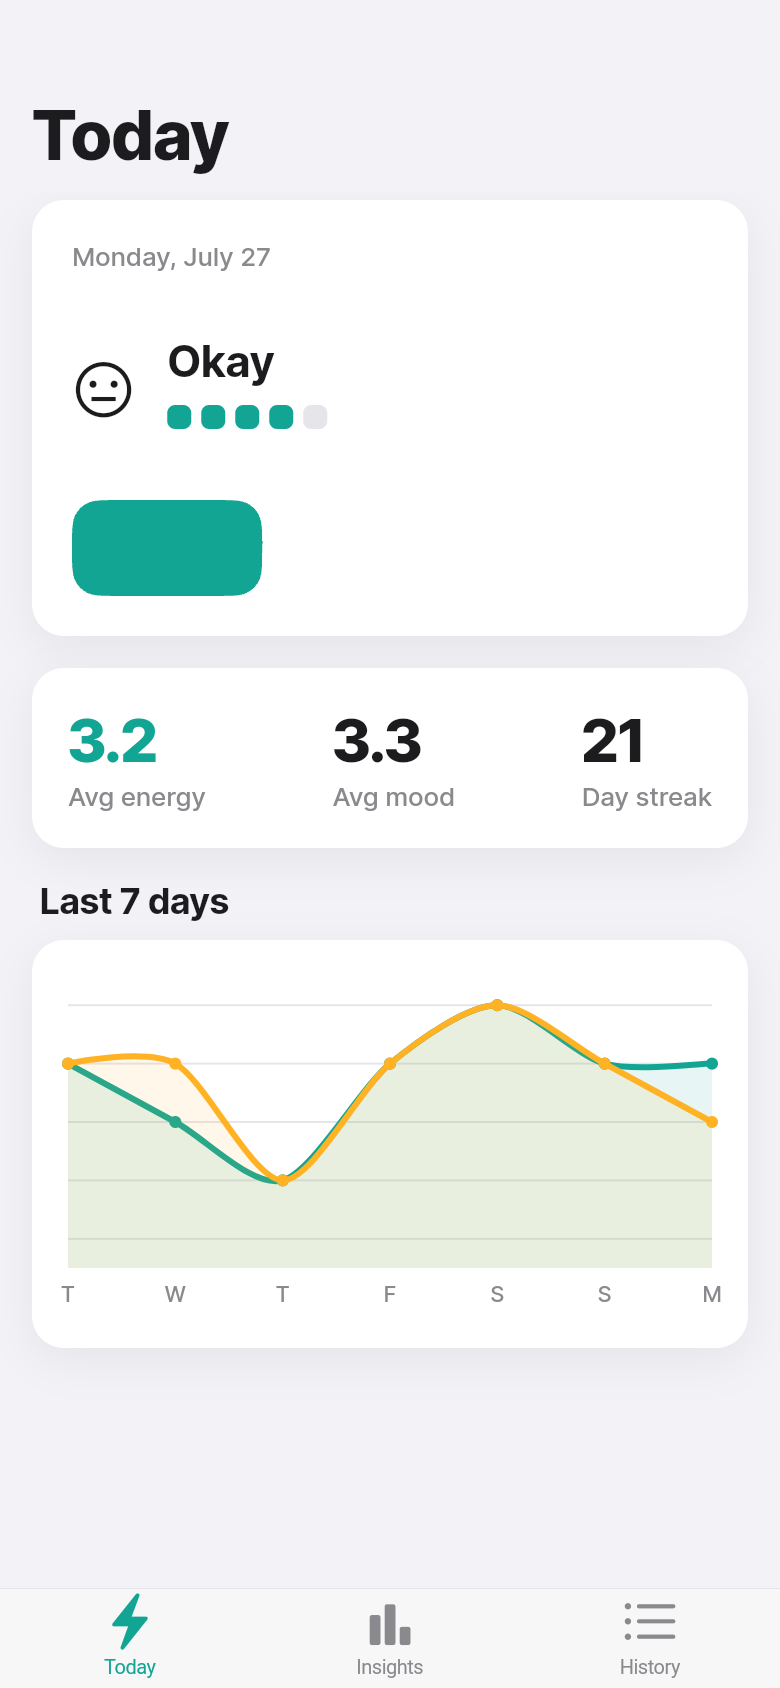
You've had the feeling: it's Tuesday afternoon, you're exhausted for no obvious reason, and by Friday you somehow feel fine. Or the reverse. Mood journal apps let you log 'feeling okay' day after day, but they never tell you *why* some days leave you hollow and others don't. The missing piece is almost always energy, not mood.
Charge Check is a daily check-in app that asks two questions instead of one: how energized do you feel, and how is your mood? It logs both, maps the relationship between them, and surfaces the pattern your week is quietly drawing. Open the live demo embedded below and give it a try before reading on.
Live demo
Why energy belongs next to mood
Mood trackers have been around long enough to have a churn problem. People log faithfully for two weeks, then stop, because the data sits there and nothing comes back from it. The app confirms you felt 'okay' on average. Not exactly motivating.
The underlying issue is that mood alone is a noisy signal. You can be in a decent mood but running on empty, or feel anxious but physically wired. Energy is the other axis, and when you track both together you start to see a shape emerge: the days your energy is a 4 and your mood follows it up, the days mood drops first and energy tanks the next morning.
Wearables give you a 'body battery' score, but they can't tell you how you *subjectively* experienced the day. Charge Check sits in that gap: a quick daily log that takes ten seconds and gives you, over time, a legible read of your own rhythms.
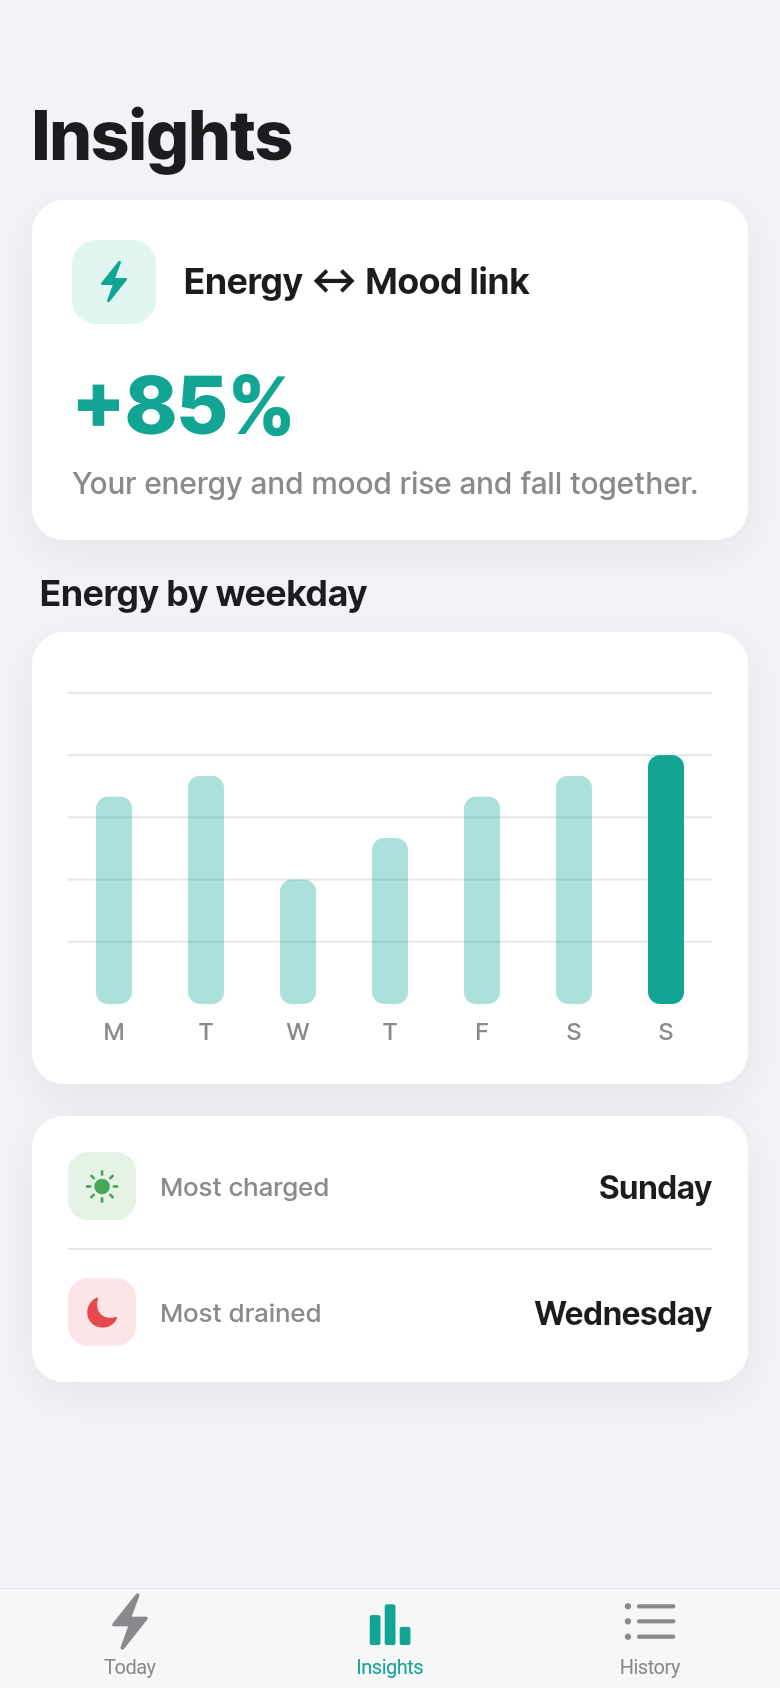
One entry, two numbers, one clear pattern
The logging screen keeps it simple on purpose. You tap a 1-5 scale for energy, a 1-5 scale for mood, and optionally add a short note. That's the entry. No questionnaires, no symptom lists, no prompts asking you to rate seventeen dimensions of your wellbeing.
On the Insights tab, the app does the math you'd never bother doing yourself. It computes a correlation headline between your energy and mood readings and surfaces it in plain language, so instead of staring at two lines on a chart you get something like 'your mood closely tracks your energy levels.' Useful. Concrete. Yours.
The 7-day trend chart lets you see recency at a glance, while the weekday breakdown is the feature that tends to surprise people most. It averages your energy score for each day of the week across your entire log history, which makes patterns visible that you'd otherwise explain away as coincidence. Mondays consistently under 3? Thursdays reliably higher? Now you can see it, and you can start asking what's different about those days.
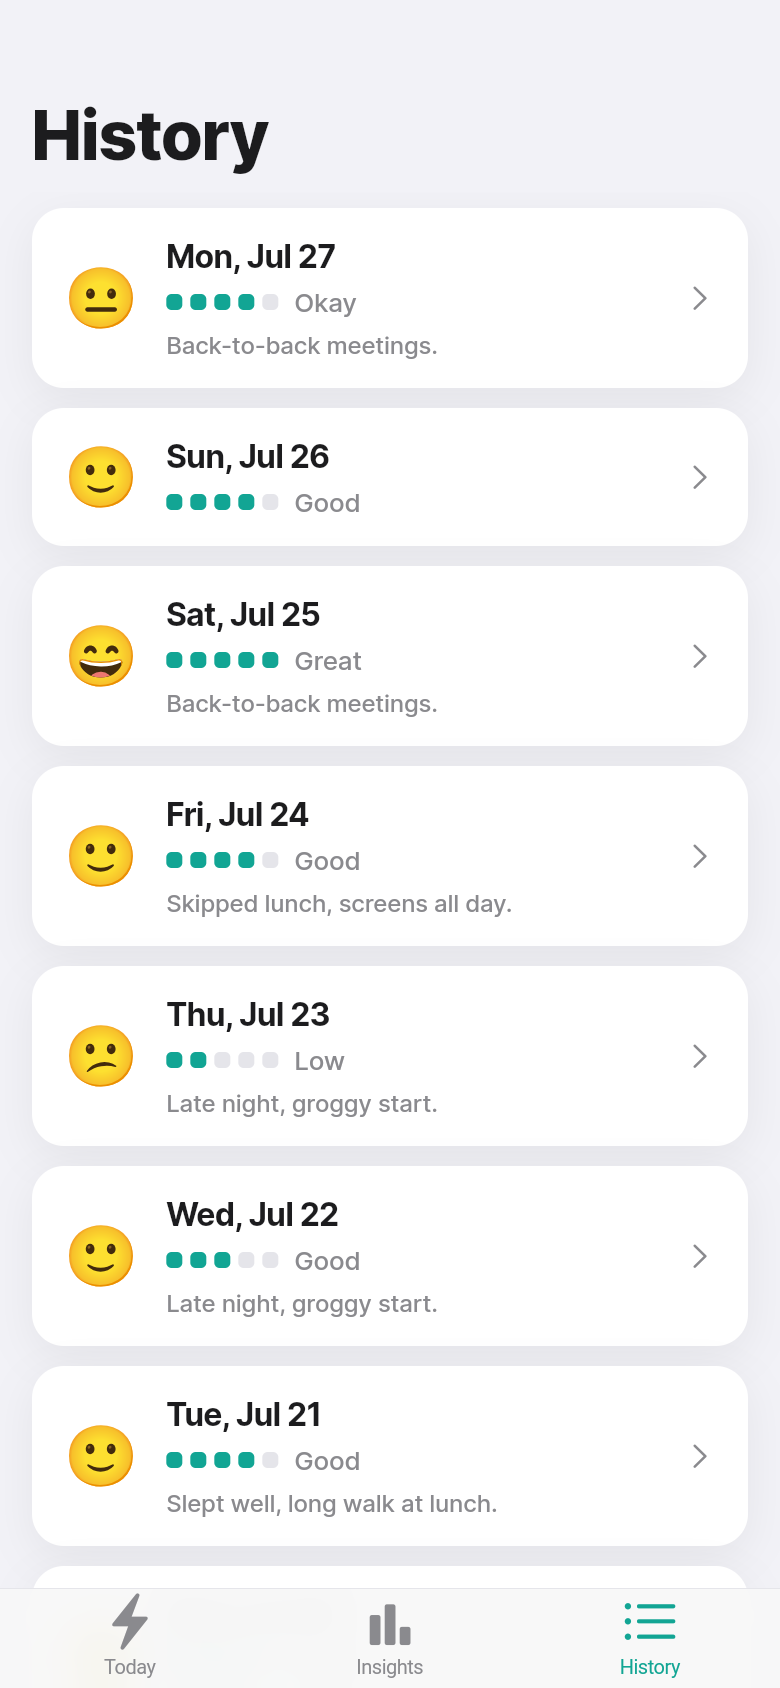
Built for the phone in your pocket, not a clinical dashboard
Charge Check is designed for self-aware people managing ordinary human wear-and-tear: knowledge workers who notice they're crashing mid-week, students juggling schedules that don't respect their natural energy curve, anyone coming back from burnout who wants a lightweight pulse check rather than a therapy tool.
It opens instantly and works fully offline. Your data stays on your device. There's no account to create, no subscription to consider, no server to depend on. The app ships with believable seeded history so the charts are meaningful from day one rather than showing you an empty graph asking you to log more.
The design follows Cupertino conventions closely: large titles, grouped cards, a single calm accent color, tab navigation. It feels like it belongs on your phone, not like a prototype. That's not an accident. When a check-in tool feels foreign, you stop opening it. When it feels native, logging becomes a reflex.
Using it: what the first week looks like
Day one, you log once. Maybe you add a note about a rough meeting or a good run. The chart shows one point. The correlation insight is provisional. That's fine.
By day four or five, something shifts. The weekday bars start differentiating. The 7-day lines start bending in directions that feel familiar, like the app is reflecting something you already half-knew but hadn't articulated. By day ten you have a baseline, and when an unusually low week comes, you can actually see it against what's normal for you, not against some population average.
That feedback loop is what keeps people logging. Not gamification, not streaks, not badges. Just the quiet reward of understanding yourself a little better than you did last week. Try the interactive demo above: log a couple of entries and watch the insights tab update in real time.
From a one-line idea to a working app
Charge Check started as a simple brief: people track mood but miss energy, and the relationship between the two is the thing that actually matters. From that premise, the app took shape quickly, with a clear opinion about what to include and, just as importantly, what to leave out.
No social features. No reminders that hound you. No export formats or integrations. Just the check-in, the correlation, and the trend. Sometimes the best tool is the one that does one thing well and gets out of the way.
If you've been thinking about a tool for your own specific problem, a daily ritual you want to track, a pattern you want to surface, or a workflow you want to simplify, that same approach applies. Start with the problem, keep it focused, and build something that actually fits how you think.
39
files in the build
40.1 MB
app bundle
Flutter Web
runs in any browser
Have an idea for your own tool?
Charge Check went from a one-line brief to a working app with real data, real charts, and a design that feels native. If you have a problem worth solving, bring your idea and we'll build it.