
finance
Spend Streaks: See Your No-Spend Days at a Glance
A lightweight heatmap app that turns every no-spend day into a visible win, so you can build streaks and spot patterns without linking your bank.
Artem
Founder
· 5 min read
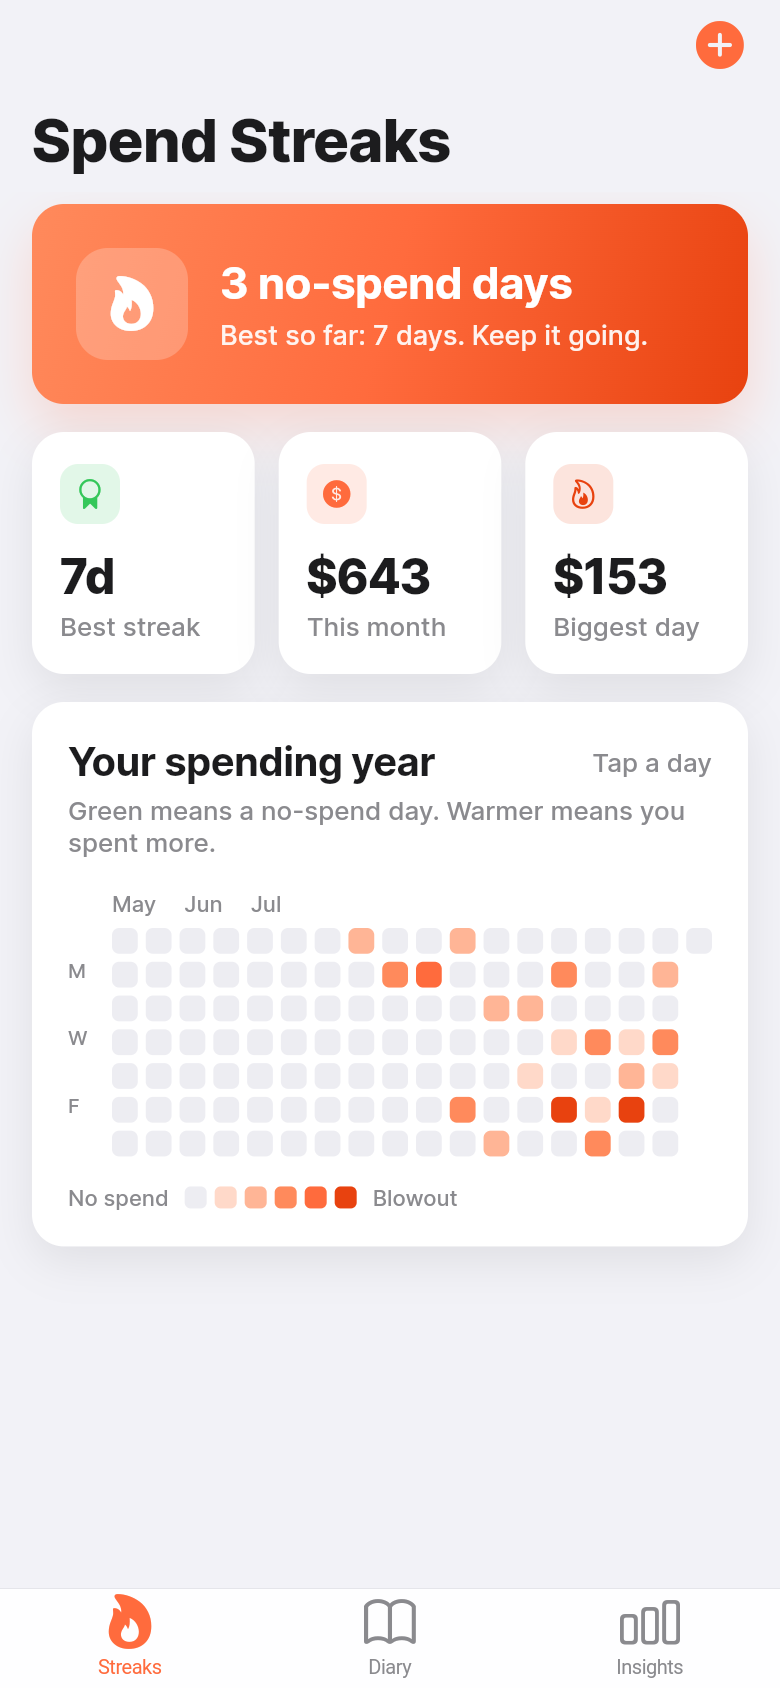
Most people don't realize how often they spend money until the monthly statement lands and the total feels wrong. The individual purchases are small enough to forget, but they add up fast, and nothing connects the dots in real time. Spend Streaks fixes that with one idea borrowed from developer contribution graphs: a calendar heatmap where every day is a colored tile, green for no spend, deeper tones for heavier days.
There's no bank linking, no subscriptions to categorize, no dashboard that takes twenty minutes to set up. You log a purchase in a few taps, and the calendar updates instantly. Over a week or two, a picture forms that no spreadsheet would ever show you: which days you consistently stay clean, which days you blow it, and whether your current no-spend run is longer than anything you've managed before.
Live demo
The heatmap that makes not-spending feel good
The first thing you see when you open Spend Streaks is the calendar. Each day is a small tile. Days where you logged nothing are a clean, quiet green. Days with purchases shade from light to deep depending on how much you spent. At a glance, you know where you stand for the month without reading a single number.
This matters because most budgeting feedback is abstract. A dollar figure at the bottom of a spreadsheet doesn't feel like anything. A solid row of green squares does. The heatmap borrows the same psychology that makes GitHub contribution graphs oddly motivating: you can see the gap you'd break if you slipped today, and that's often enough to pause before a small, unnecessary purchase.
The app is designed so the heatmap is never empty. It comes with a few starter entries already in place, so from the moment you open it, the calendar looks like yours. You aren't staring at a blank grid wondering if the app even works.
Log a purchase in three taps
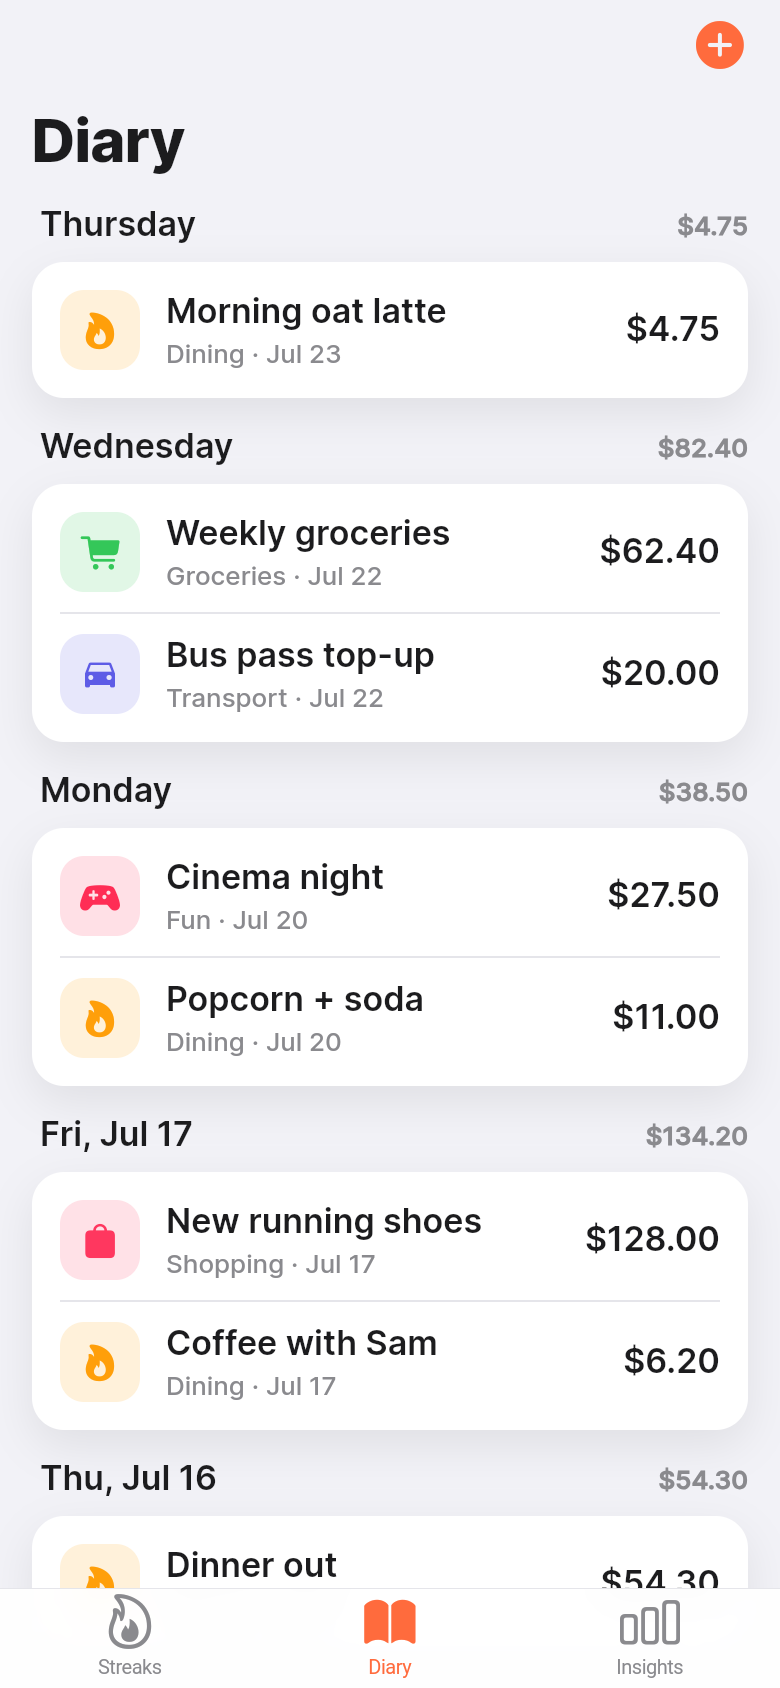
Adding a spend is intentionally fast. You tap the plus button, type a short title, enter the amount, pick a category, and you're done. The date defaults to today; tap it to backfill yesterday or last Thursday if you forgot to log in real time. That's the whole entry flow.
Categories keep things just organized enough for the weekly breakdown to mean something. Groceries, dining, transport, entertainment, and a few others cover most daily life. You're not building an accounting system, just tagging things loosely so the breakdown chart can show you whether your spending is mostly food or mostly convenience purchases.
Because the app runs entirely offline and stores everything locally on your device, there's no account to create and nothing to sync. Your data doesn't go anywhere. That also means it opens instantly, every time, with no loading screen waiting on a server.
The streak is the point
At the top of the screen, Spend Streaks shows two numbers: your current no-spend streak and your longest one ever. These are the hero metrics, and they're deliberately simple. If you went five days without logging a single purchase, the counter reads five. Spend anything today and it resets to zero.
That reset is the mechanic. The longer your streak runs, the more a small impulse buy costs in psychological terms, not just financial ones. You're not just spending four dollars on a coffee, you're ending a twelve-day run. A lot of the time, that framing is enough to make you reconsider, or at least wait an hour and see if the urge passes.
The longest-streak number gives you a personal benchmark. If your record is eight days and you're sitting at six, you know exactly what you're chasing. Beating your own best is a quieter motivation than leaderboards or badges, but it tends to stick longer.
Weekly and category breakdowns for a quick self-review
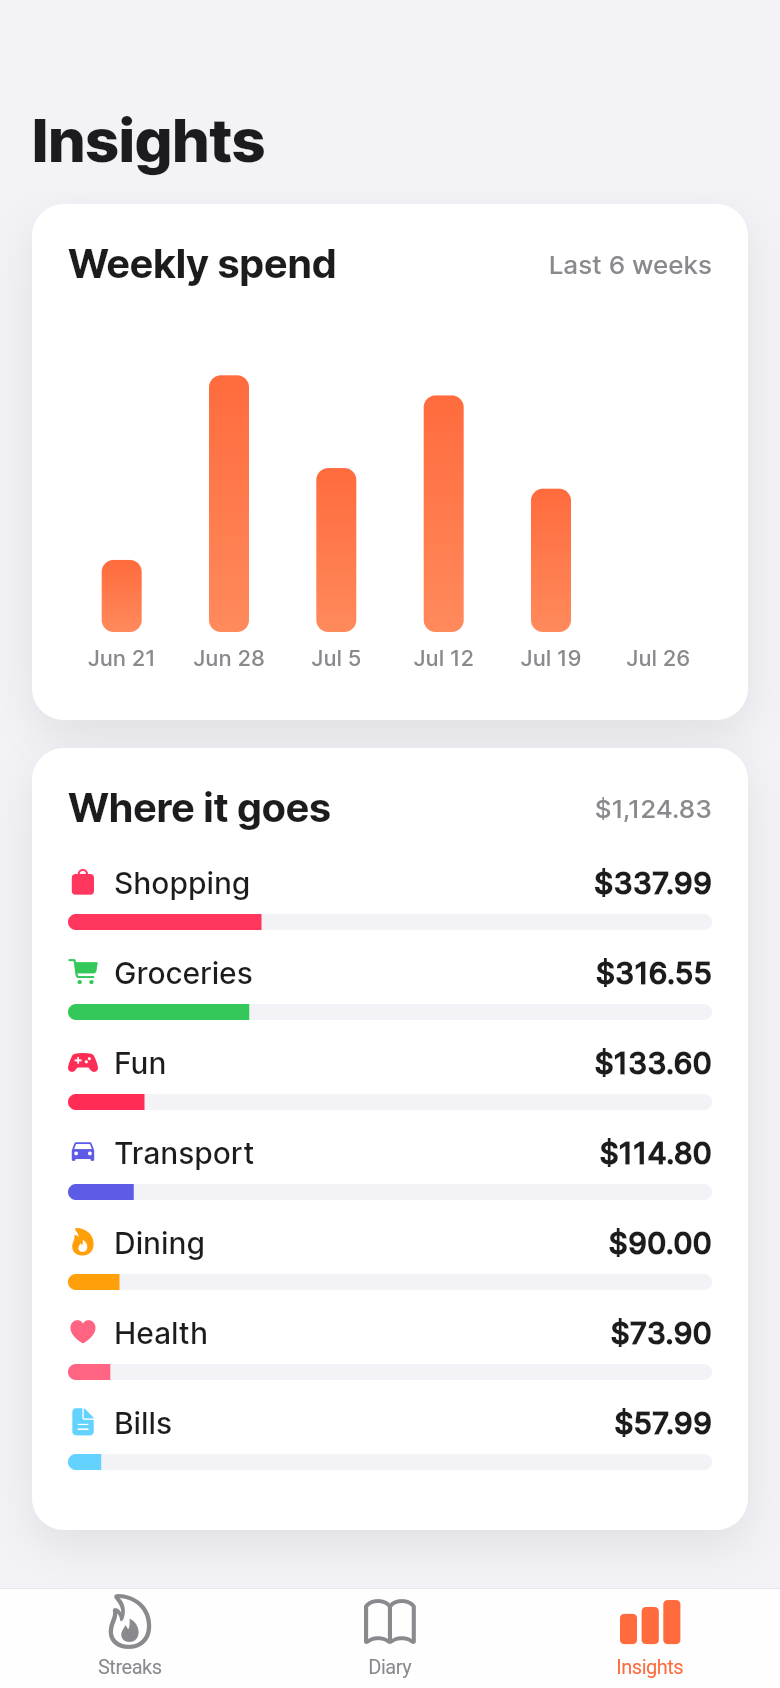
Below the heatmap, the app breaks your spending down by week and by category. The weekly view lets you spot patterns across the month: maybe you consistently overspend on weekends, or the third week of the month is always your tightest. Seeing it charted beats trying to remember.
The category breakdown answers the question most people ask when they're trying to cut back: where is it actually going? If dining out is twice as tall as everything else, you know where to focus. If it's mostly transport and groceries, the picture is different. Neither judgment is built in, just the numbers laid out so you can draw your own conclusions.
Try tapping the embedded demo above. Log a fictional purchase, watch the heatmap tile change color, and check how the streak counter responds. The whole interaction takes about fifteen seconds, which is roughly how fast it works in real daily use.
Who this is for, and who it isn't
Spend Streaks is built for people who want to be more conscious about spending without turning it into a part-time job. If you've tried a full budgeting app and found it exhausting to maintain, or if you've done a no-spend challenge on Reddit but had no tool to track it, this fits the gap. It's also good for anyone who responds well to streak mechanics: if Duolingo's daily reminder system keeps you practicing a language, the same psychology applies here.
It's not a replacement for a complete personal finance setup. It won't project your retirement savings, reconcile with your bank, or warn you when you're close to a budget limit. It does one thing: make your spend and no-spend days visible, and make the streak feel real. For a lot of people, that one thing is what was actually missing.
39
files in the build
40.2 MB
app bundle
Flutter Web
runs in any browser
Build your own habit tracker from a one-line idea
Spend Streaks started as a simple idea: show me which days I spent money. From that single sentence, Leanfinit built the heatmap, the streak counter, the category log, and the weekly chart. If you have an idea for a tool you'd actually use, try describing it and see what gets built.